
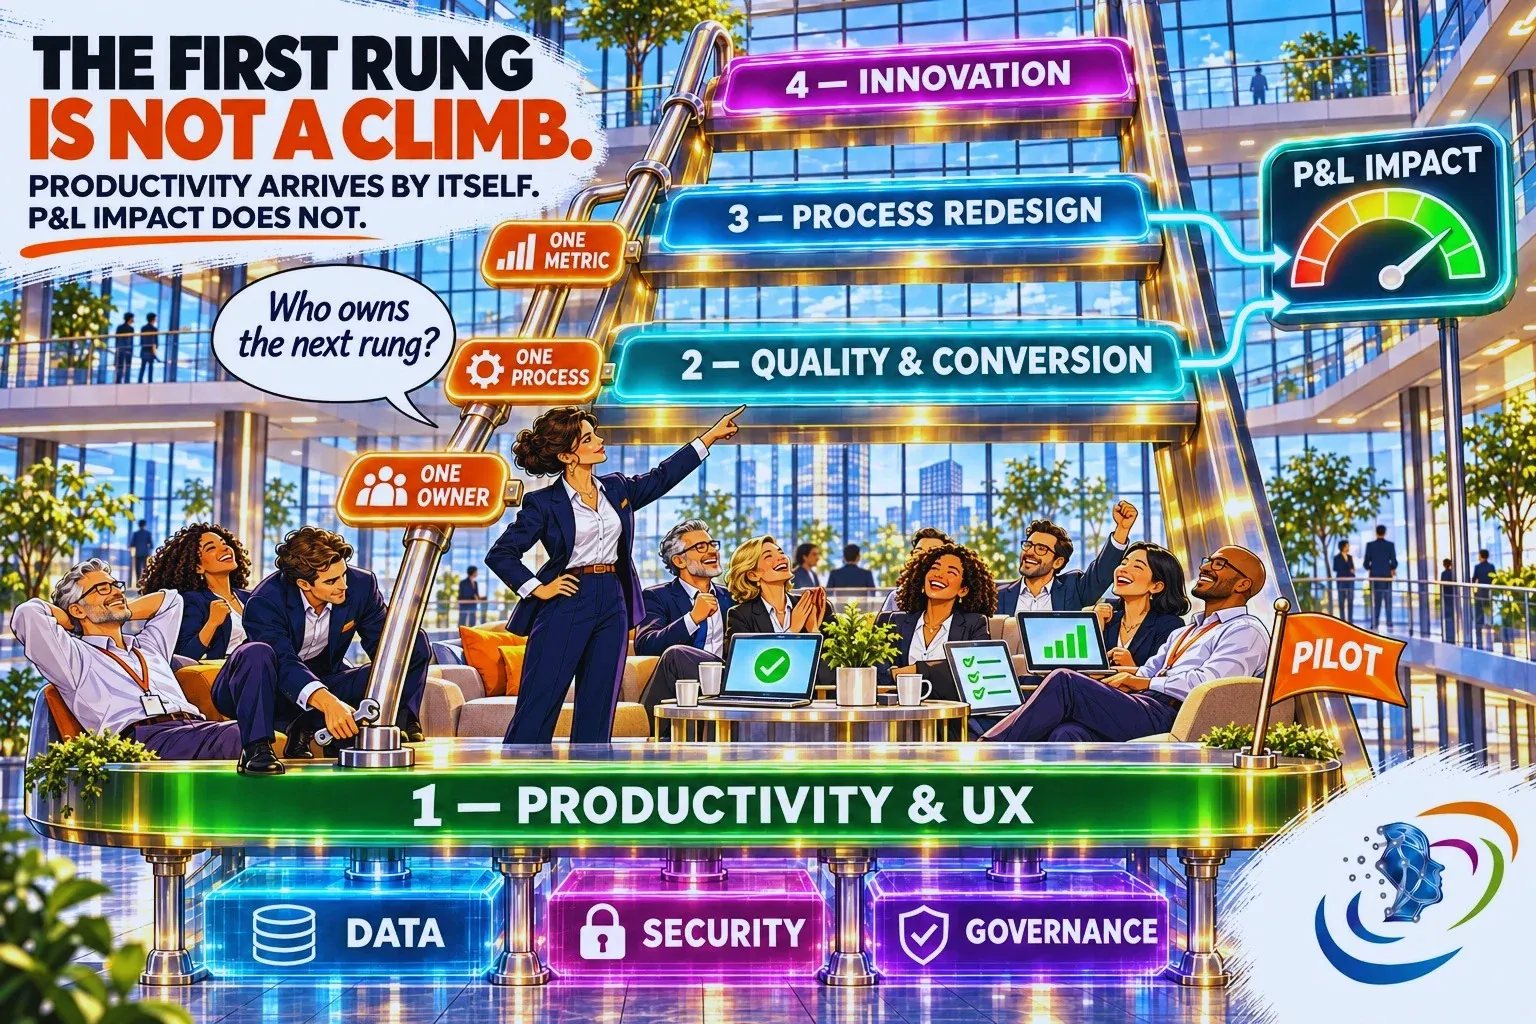






The second P&L: why the most valuable work a services team does never appears on its own scoreboard

Services leaders spend years earning the right to be run as a business. Then they discover that the expansion they caused, the churn they prevented and the products they made implementable all land on someone else's page. What I measured, what I missed, and the four lines I now publish every month.
In 2025, the average EBITDA of professional services organisations was 9.9%, against a five-year average of 13.8%, and billable utilisation fell to 66.4%, the lowest level in the nineteen years SPI Research has run its benchmark, built this year on 509 organisations. The page on which services has always been judged is under pressure everywhere.
Now take a figure from the other side of the business. In a survey of 161 customer success and onboarding leaders published by Onramp in 2025, 57% of companies that had cut their onboarding investment saw churn rise within six months.
Put the two together and you have the subject of this article. Services is measured on one page. The consequences of what it does, or stops doing, arrive on another.
The fight I won
When I took over pre-sales and operations for services at my former company, services was not run as a business. It was an enabler, a cost the company accepted so that the software would work, and its contribution margin was negative.
I rebuilt the chain from pre-sales to delivery with one scoreboard: revenue, gross margin, utilisation, bill rate, subcontracting. I put a sold margin and its assumptions on every project and made project managers accountable for it. I moved pricing from days to packaged scopes wherever a project was repeatable. Three years later, the contribution margin was plus 8% and the business had grown by 10%. I was later promoted to lead professional services for EMEA, a team of 500 people. I had won the argument that services deserved a P&L, and I still count it among the best things I have done.
The account that showed me the limit
Years later, at another software vendor, one of our largest accounts came up for renewal. Its rollout had stalled long before, for reasons older than our contract. I put a small task force on the customer's site, and my team spent weeks there, most of them never invoiced. The customer renewed.
On my P&L, that quarter showed a dip in utilisation and a project in the red. On the company's P&L, it was the best thing services had done all year. Nobody could see it, because I had built a scoreboard for a supplier, and the company needed services to behave like an owner.
The capital problem of services is not margin
The industry tells itself the problem with services is margin: too low, too volatile, too dependent on utilisation. That is a symptom. The root problem is that a services P&L measures services as a supplier, and a software company needs services as an owner of the outcome.
Everything services does as an owner lands on somebody else's page. The subscription that expands because the implementation was done right lands with sales. The churn that did not happen lands nowhere. The methodology built so that a new product could be implemented at all lands in R&D's success. The weeks spent rescuing a stalled project land in a line called non-billable, which is the only word our industry has for heroism.
I have sat on all three sides of this table. In IT at a consumer goods company and later at a retailer, I was the customer who paid for software and then paid again for its adoption. At Capgemini, I sat on bid committees where we could decline a deal that would not make its margin. At software vendors, I learned that you almost never can: the customer has already bought the software, so you go in. That asymmetry is the whole case for a second P&L. The vendor's services team takes risks an SI would refuse, and reports them with an SI's metrics.
The four lines of the second page
All four exist in the data today. Almost nobody joins the tables.
- Expansion and renewal by who led the implementation. Accounts where the vendor's own team led, where a partner led, where nobody did. Subscription growth, renewal rate and time to first value for each cohort.
- Rescues, recorded as investments. Every week spent recovering a stalled rollout, logged under its own category with a named sponsor, instead of disappearing into non-billable.
- Enablement before revenue. The tooling and methodology services builds so that a new or acquired product can be implemented. Sales counts it the day it sells. Services paid for it a year earlier.
- What delivery sent back to product. The number of product changes that began as a finding on a customer site. It is the only line that proves the feedback loop exists.
No CEO I’ve ever worked for has ever asked me about the usage rate. They asked whether the client was in production, and whether they were going to renew. The second page answers the questions the CEO actually asks.
What the first page does to your people
A scoreboard that only pays for billable configuration manufactures excellent configurators. At my former company I rebuilt the skills matrix person by person, and the pattern was the same in every team: deep in one module, silent on the business question around it. Customers did not want five experts in five modules. They wanted one person who could tell them what their function would look like after go-live.
You cannot ask consultants to have that conversation on top of a full billable week. The time has to be freed first. So we automated the first design: the delivery team captured the customer's context, and a first design document was generated from it. Design time fell by about 30%. I gave all 500 people access to the AI tools, under guardrails, and ran workshops between R&D and delivery so that consultants understood what was behind the AI in the product. Then I spent the freed hours moving technical people towards business conversations, one skills profile at a time. Some made the shift and some did not, and I had to accept that. Free the time, then broaden the skill. In that order, or neither happens.
When the hour disappears, where does the value go
The same logic applies to the offer. When the implementation hour disappears, value has to move into something you can sell: activation, adoption, hypercare, an outcome.
About ten years ago, at an engineering software vendor, I built a marketplace that priced engineering services on the outcome delivered rather than the days spent, with the revenue shared between the engineering firms and the end customers. Thirty partners joined in six months, and the business returned 30% on the capital employed. I learned there what I have applied ever since: the hour was never the product. It was only the easiest thing to count.
Five moves for the executive committee
If I were to structure this for a software publisher’s services division this quarter, there would be five decisions.
- Publish the second page next to the first. Monthly, in the same review, with the sales and customer leaders in the room. A number that lives in a separate deck is a number nobody defends.
- Run the cohort comparison this quarter. Renewal rate and expansion for accounts implemented by your own team, by a partner, by nobody. The data is already in the CRM. If the three come out the same, you have learned something important. In my experience they do not.
- Give rescues and enablement a budget and a sponsor before a timesheet code. Once the company has agreed it is an investment, it stops being a favour.
- Measure consultants on value realised, not projects completed. A go-live is a milestone. The metric is whether the customer is using what they bought ninety days later.
- Free the time before you broaden the skill. Automate the first design and the first test plan, then move profiles from configuration to business conversations. The second without the first is a speech.
The P&L, redefined
Stop fighting to be run as a P&L. If you lead services at a software company, you have probably won that fight, and it was worth winning.
The real question is what your P&L cannot see: the expansion you caused, the churn you prevented, the product you made implementable. Those sit on other people's pages, and as long as they do, services will be planned one point of utilisation at a time.
Most of what services earns a company is never invoiced. Publish the page that shows it.
This article is adapted from edition #[N] of my LinkedIn newsletter, Professional Services & Tech. Subscribe on LinkedIn to receive future editions.
Sources:
SPI Research, 2026 Professional Services Maturity Benchmark (19th edition);
Onramp, "The First 90 Days: Why Customer Onboarding Is the New Battleground for Customer Retention," survey of 161 customer success and onboarding leaders (May 2025).
Mathilde HENRY
Executive Leader in Enterprise Software & AI Transformation. 20 years working at the intersection of software, consulting and business transformation.